Fantasy Football has made America a nation of general managers. We love spouting opinions about the NFL Draft, despite having only a fraction of the information actual GMs have. (Then again, knowing less might be a good thing — if, as they say, overanalysis leads to paralysis.)
Anyway, I decided to crunch a bunch of numbers and see where it led, just to get a sense of how much of a crapshoot the draft really is. What I looked at were the first three rounds — or rather, three blocks of picks: 1 through 32, 33 through 64 and 65 through 96 (since rounds weren’t always as long as they are now). This, I figured, would enable me to compare across eras . . . and possibly to come to some conclusions about whether scouting departments have gotten any better at this Inexact Science.
What I zeroed in on were Hall of Famers and Pro Bowlers, the guys who — hypothetically, at least — are the biggest difference makers for their teams. Granted, there are more Pro Bowl berths these days (and more alternates who end up playing) so the definition of a “Pro Bowler” has changed over the decades. But it’s still worth looking at this stuff — especially in the offseason, when you’ve got the time to do it.
Let me throw a few numbers at you to get us started:
● There’s a 4.8 percent chance a first-round pick will make it to Canton (122 Hall of Famers in 2,528 first-round — or First 32 — selections). The percentage drops to 1.2 percent for second-rounders (31 of 2,528) and 0.8 percent for third-rounders (21 of 2,528). So you’re four times less likely to find a Hall of Famer in Round 2 and about six times less likely to find one in Round 3.
● There’s a 35.7 percent chance a first-round pick will play (or be voted to) the Pro Bowl (743 Pro Bowlers in 2,080 first-round — or First 32 — selections since 1950, when the first modern Pro Bowl was held.) The percentage drops to 16.8 percent for second-rounders (350 of 2,080) and 11 percent for third-rounders (228 of 2,080). So you’re about two times less likely to find a Pro Bowler in Round 2 and about three times less likely to find one in Round 3.
What does this tell us — or confirm for us? Answer: That for all the mistakes in the first round, those picks are much more likely to yield a difference-maker (and possibly a Hall of Famer) than picks in the next two rounds. And for the same reason, second-round selections are much more valuable than third-rounders.
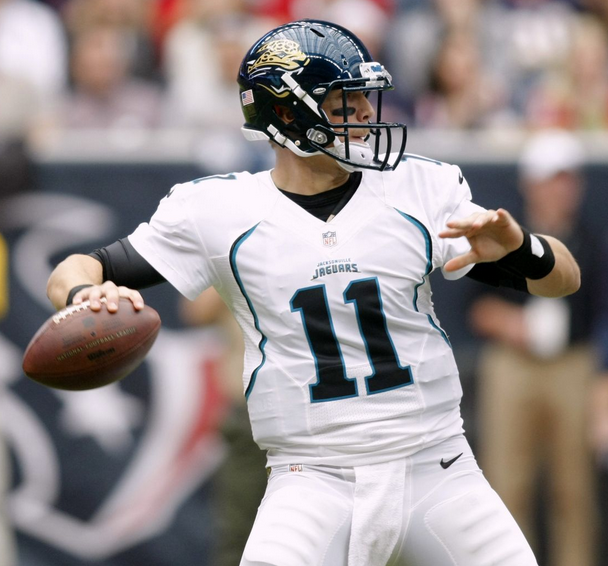
Blaine Gabbert went one pick ahead of J.J. Watt in 2011.
In other words, clubs — with their various rating systems — are doing a good job of identifying generally which players are going to be NFL stars. (“Everybody above this cutoff point on our scale is a potential Pro Bowler.”) But they continue to have problems identifying specifically which players are going to be stars. That’s why you have J.J. Watt, a defensive end for the ages, being drafted 11th in 2011, behind quarterback busts Jake Locker (eighth) and Blaine Gabbert (10th). It’s also why you had three consecutive running backs fly off the board in the first round in 2008 . . . in the exact opposite order from how they should have been selected. Based on their career rushing totals, the order should have been: Chris Johnson (8,628 yards), Rashard Mendenhall (4,236) and Felix Jones (2,912). Instead, Jones went 22nd, Mendenhall 23rd and Johnson 24th.
Here’s the decade-by-decade breakdown:
(Note: HOFers = Hall of Famers, PBers = Pro Bowlers.)
WHAT THE TOP 3 ROUNDS OF THE DRAFT HAVE YIELDED
| Years | Picks 1 through 32 | Picks 33 through 64 | Picks 65 through 96 |
|---|---|---|---|
| 1936-49 | 19 HOFers, PBers DNA | 3 HOFers, PBers DNA | 3 HOFers, PBers DNA |
| 1950-59 | 20 HOFers, 118 PBers | 7 HOFers, 57 PBers | 5 HOFers, 35 PBers |
| 1960-69 | 32 HOFers, 119 PBers | 4 HOFers, 58 PBers | 6 HOFers, 46 PBers |
| 1970-79 | 18 HOFers, 101 PBers | 7 HOFers, 42 PBers | 3 HOFers, 38 PBers |
| 1980-89 | 23 HOFers, 121 PBers | 7 HOFers, 63 PBers | 3 HOFers, 37 PBers |
| 1990-99 | 10 HOFers, 107 PBers | 3 HOFers, 53 PBers | 1 HOFer, 42 PBers |
| 2000-09 | 0 HOFers, 132 PBers | 0 HOFers, 64 PBers | 0 HOFers, 22 PBers |
| 2010-14 | 0 HOFers, 45 PBers | 0 HOFers, 13 PBers | 0 HOFers, 8 PBers |
Obviously, the jury is out on the last two groups. Many of the players, after all, are still active. As for the earlier decades, those Hall of Fame totals aren’t final, remember; they’ll undoubtedly grow over time, helped by Veterans Committee selections. Still, the data gives us a snapshot — something to go on. And one thing that jumps out at you is that teams aren’t necessarily drafting any better now than they were in the ’50s and ’60s, when the process wasn’t nearly as thorough.
The number of Hall of Famers, of course, may say more about the depth of the talent pool than the competence of the drafters. (All decades are not created equal.) It’s fascinating, though, that clubs in the ’60s drafted 32 Hall of Famers in the First 32 but found only 18 in the ’70s and 23 in the ’80s.
The number of Pro Bowlers, though, is fairly consistent from decade to decade – until the 2000s, when all kinds of changes were made that basically opened the floodgates. With the game scheduled before the Super Bowl nowadays, more and more players get to call themselves “Pro Bowlers.”
It’s something to think about as we get ready for draft — which, now that the NFL has its own network, seems to get more self-congratulatory with each passing year. There’s nothing in this data to suggest the GM-geniuses of 2015 (and their support staffs) are any more clairvoyant than the GMs of 50 years ago. If someone wants to go further and look at other ways of evaluating Draft Day performance — such as the number of starters drafted in each round or the number of games those guys played — by all means have at it. Just wanted to get the ball rolling.
More on this subject tomorrow.
Source: pro-football-reference.com
